Independent Insights into Market Structure, Venue Performance and Liquidity Dynamics
LiquidMetrix Liquidity Insight provides insight into market structure, liquidity distribution, and venue quality across global equity and ETF markets, helping firms understand where liquidity resides, how markets behave, and how trading activity evolves over time.
What Market Intelligence Covers
LiquidMetrix’s Liquidity Insight platform is built around four modules: each answering a core question about how and where markets trade. Explore each in detail below.
Venue Statistics
Evaluate market share, venue quality, spread dynamics, and trading activity across trading venues.
Liquidity Intelligence
Identify where liquidity resides and analyse addressable liquidity across venue types and market participants.
Intraday Market Activity
Monitor volume, volatility, auction behaviour and trading activity throughout the trading day
Market Trends
Track how market behaviour evolves across sectors, countries, indices and time periods.
Venue Statistics
Understand where trading takes place and how venues compare
Venue Rankings
Rank and compare venues by market share, volume, and turnover across global markets, so you can see who leads and how positions shift.
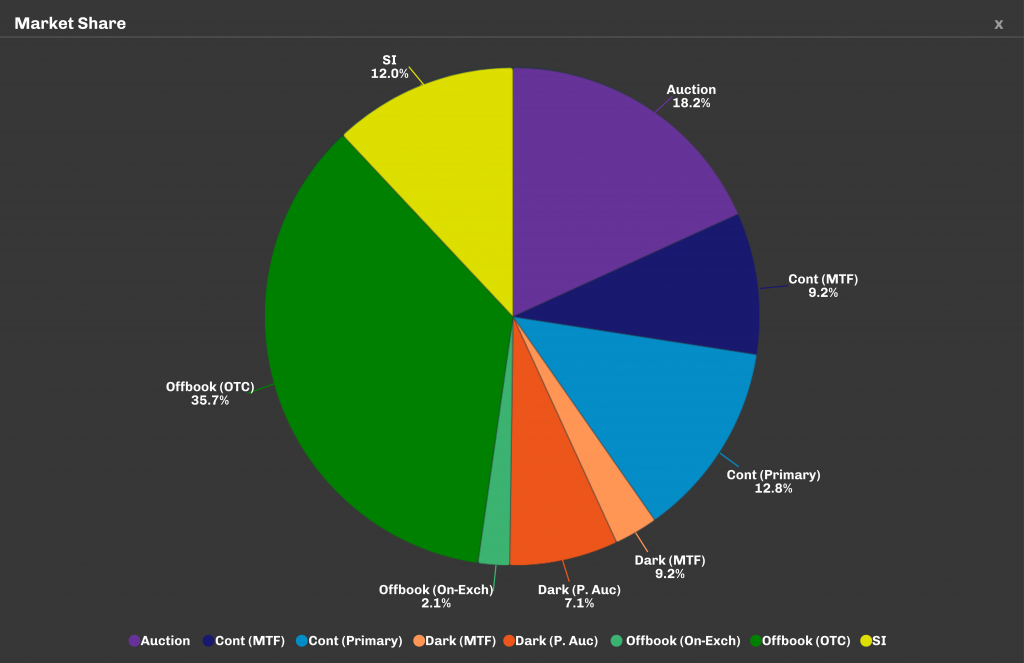
Market Share Analysis
Understand how trading is distributed across Exchanges, MTFs, and alternative venues, revealing where flow concentrates and where it fragments.
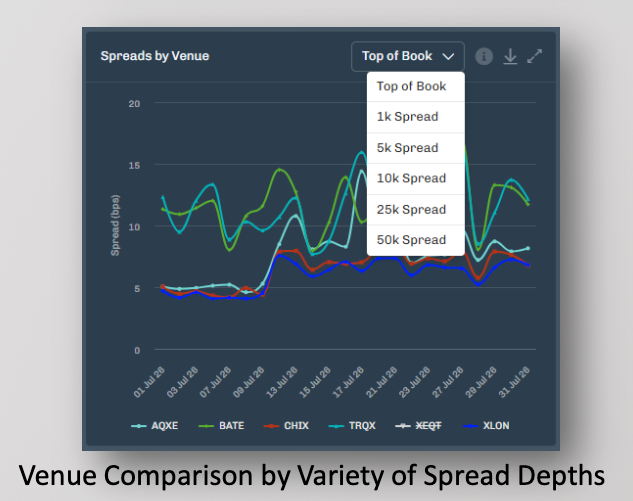
Market Quality
Look past raw volume to evaluate each venue on liquidity, depth, spread, and broader market-quality indicators: the true measure of execution value.
Lit vs Dark Activity
Liquidity Intelligence
Analyse the availability, accessibility, and sources of market liquidity
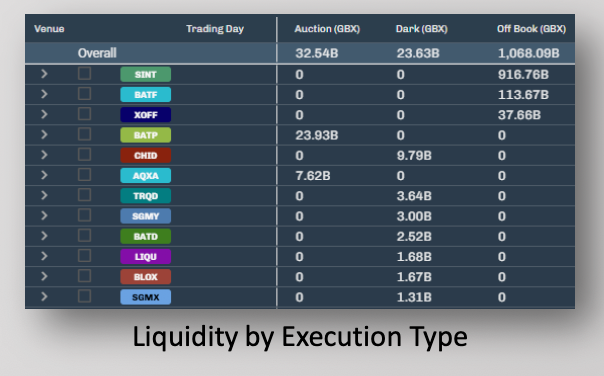
Not all liquidity is equal — and not all of it is actually reachable. Liquidity Intelligence looks past headline volume to show you where liquidity truly resides, how much of it you could realistically access, and how it behaves once you do. It breaks activity down by source and execution type, so you can separate the liquidity that works for you from the noise around it.
Addressable vs Non-Addressable
Distinguish the liquidity traders could actually act on from the activity that was never accessible to them, so your view reflects real opportunity rather than raw prints.
SI Price Impact Analysis
Assess the market impact and execution characteristics of individual Systematic Internalisers, benchmarked against LiquidMetrix’s proprietary Peer Universe.
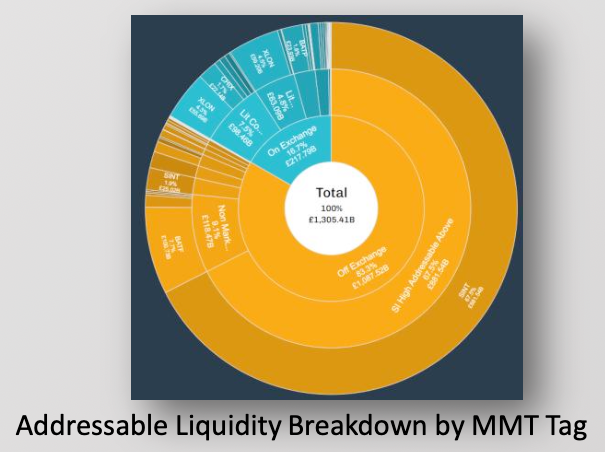
MMT Classifications
Classify liquidity using MMT trade flags and execution characteristics, giving every fill a clear, standardised context.
LIS Activity
Measure the prevalence and impact of Large-in-Scale trading, revealing how much of the market moves in size and where it happens
Intraday Market Activity
Explore volume, volatility, and trading patterns throughout the trading day
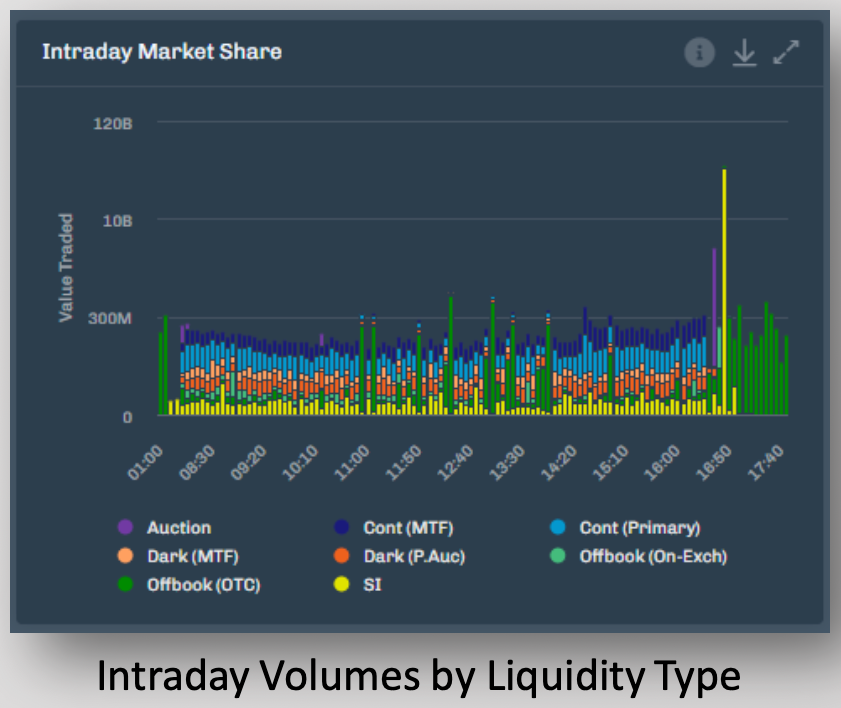
Markets don’t behave the same way at 9 am as they do into the close. Intraday Market Activity tracks how volume, price, and volatility move across the trading day — from the opening auction through continuous trading and into the close. It turns the rhythm of the session into something you can measure, compare, and plan around.
Intraday Volume Profiles
See how trading volume is distributed across the day, revealing when the market is most and least active
Intraday Price & Volatility Profiles
Track how prices move and volatility builds as the session runs into the Close, so you can anticipate the busiest, most sensitive moments
Close Auction price Volatility Analysis
Compare the significance of auction activity across the open, close and intraday auctions to understand where price is really being set.
Market Session Analysis
Compare liquidity and trading activity across continuous, extended and overnight* sessions to see how behaviour shifts outside core hours.
*Overnight session statistics supported from 2027
Market Trends
Monitor changes in market behaviour across time, sectors and regions
Single-day snapshots only tell you so much. Market Trends takes a step back to reveal how market behaviour shifts over time — across sessions, sectors, indices and regions. By drawing on deep historical data and pre-aggregated curves, it turns years of market activity into clear, comparable patterns you can plan around
Historical Statistics
Access historical daily and intraday statistics to analyse how markets have behaved and how trends have developed over time.
Volume Curves Service
Receive pre-aggregated volume curves by venue or index, averaged over configurable lookback periods, so you can benchmark expected activity with confidence.
Price Volatility Curves Around Close
Analyse average price and volatility patterns leading into the Close auction, revealing how the market typically behaves at its most sensitive moment.
Index, Country & Sector Analysis
Accessing Liquidity Insight
Liquidity Insight fits the way you already work. Whether you want data delivered on a schedule, queried on demand, explored interactively, or shaped into bespoke research, you can consume it in the format that suits your team: from raw datasets to specialist analysis.
Data Feed
Receive pre-aggregated statistics and datasets through scheduled, automated delivery
API Access
Query Liquidity Insight datasets programmatically to power custom workflows and analytics
Web Platform
Explore a curated subset of Liquidity Insight analytics through an interactive web interface
Custom Research & Analytics
Commission bespoke market-structure research and liquidity studies from LiquidMetrix experts
What is Your Data Hiding
Understand Every Venue. Every Session. Every Trend.
Your trading, order and market data already hold the answers: where liquidity truly resides, how venues really perform, and how market behaviour shifts across the day and over time. LiquidMetrix Liquidity Insight brings those answers into focus, combining full-depth global order book data, independent analytics and deep market-structure expertise in one place.